
TEAM-Greenhouse-Gas-Emissions-Overview
TEAM Energy
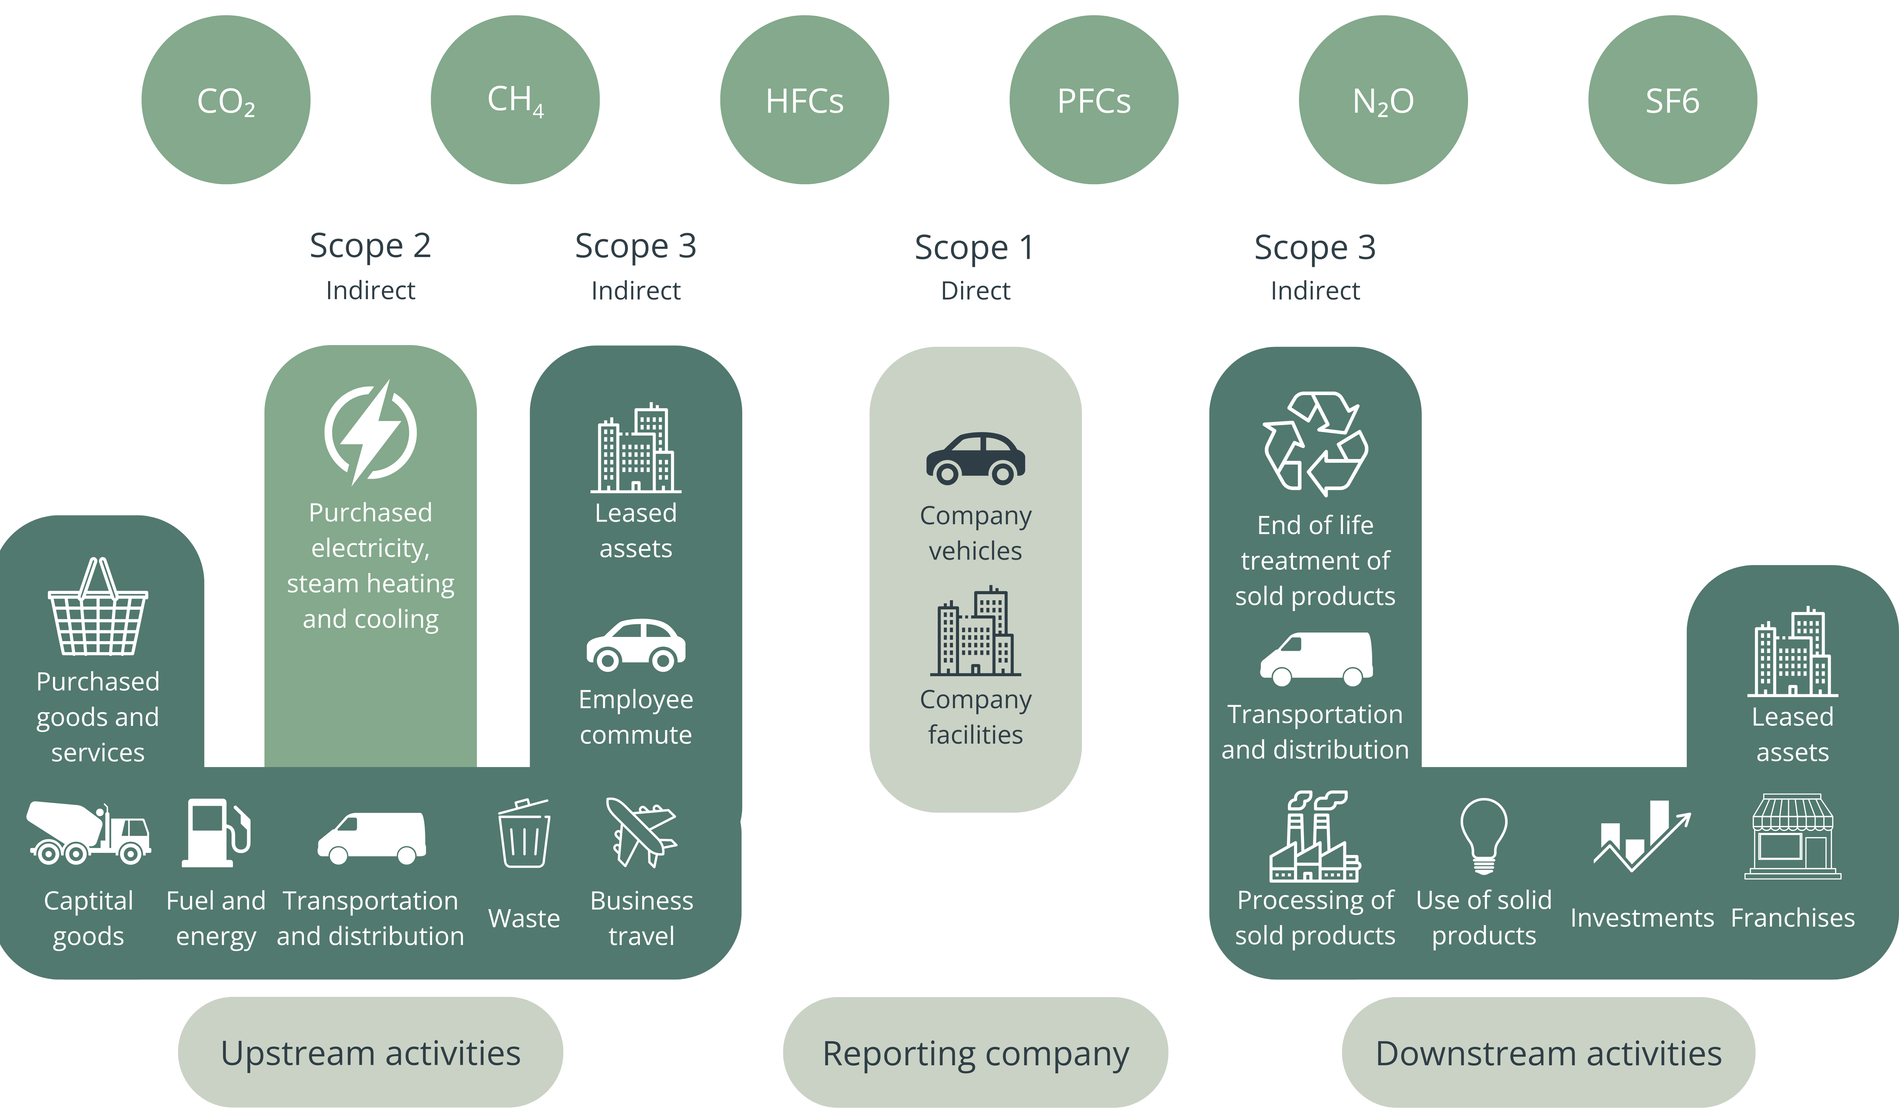
Infographic illustrating Scope 1, Scope 2 and Scope 3 greenhouse gas emissions across upstream, reporting company and downstream activities. Scope 1 shows direct emissions from company facilities and company vehicles. Scope 2 shows indirect emissions from purchased electricity, steam, heating and cooling. Scope 3 shows indirect emissions across the value chain, including purchased goods and services, capital goods, fuel and energy‑related activities, transportation and distribution, waste, business travel, employee commuting, processing and use of sold products, end‑of‑life treatment of sold products, leased assets, franchises and investments.
Credit: TEAM Energy
TEAM Energy+44 1908 690018
enquiries@teamenergy.com
teamenergy.com


