0
Your lightbox

TEAM-Energy-Efficiency-Hierarchy
TEAM Energy
0
Your lightbox
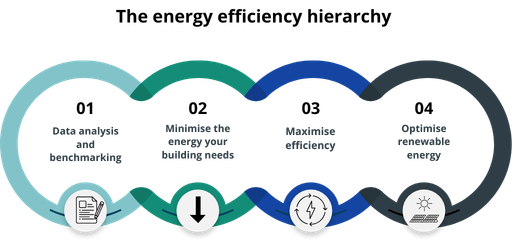
Infographic illustrating the energy efficiency hierarchy in four connected stages. Stage one focuses on data analysis and benchmarking; stage two on minimising building energy needs; stage three on maximising efficiency; and stage four on optimising renewable energy. The stages are shown as linked numbered loops with supporting icons, progressing from data and demand reduction through to renewables.
Credit: TEAM Energy
TEAM Energy+44 1908 690018
enquiries@teamenergy.com
teamenergy.com


