
Carbon Reduction and Scope Emissions
Carbon Reduction and Scope Emissions brings together a curated set of informational infographics from TEAM Energy, designed to support clear understanding of carbon reduction strategies, Scope 1, 2 and 3 emissions, sustainability reporting and Net Zero pathways. The lookbook provides journalists and stakeholders with accessible, evidence‑based visuals that explain complex emissions frameworks, regulatory contexts and best‑practice approaches for managing and reducing organisational carbon impact.
TEAM Energy
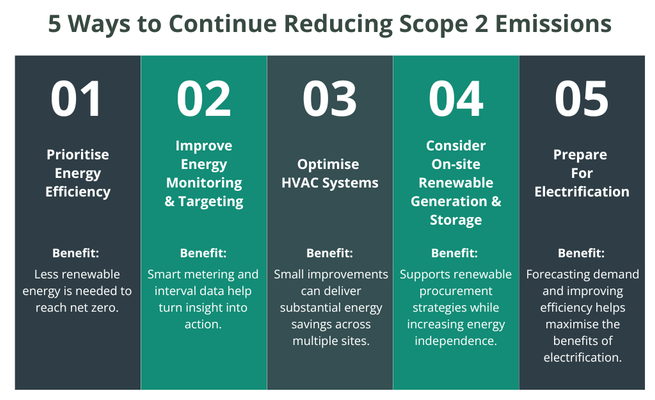
Infographic titled “5 Ways to Continue Reducing Scope 2 Emissions” presenting five numbered actions in vertical columns. The five recommendations are: (1) Prioritise energy efficiency, with the benefit that less renewable energy is needed to reach net zero; (2) Improve energy monitoring and targeting, with smart metering and interval data helping turn insight into action; (3) Optimise HVAC systems, with small improvements delivering substantial energy savings across multiple sites; (4) Consider on-site renewable generation and storage, supporting renewable procurement strategies while increasing energy independence; and (5) Prepare for electrification, with demand forecasting and efficiency improvements helping maximise the benefits of electrification. The design uses alternating dark grey and teal panels with large white numbers.
Credit: TEAM Energy

TEAM Energy
Diagram showing an effective approach to Scope 3 emissions: prioritising suppliers and categories, starting with broader data coverage, targeting better data selectively, using hybrid methods, and using data to inform action.
Credit: TEAM Energy
TEAM Energy
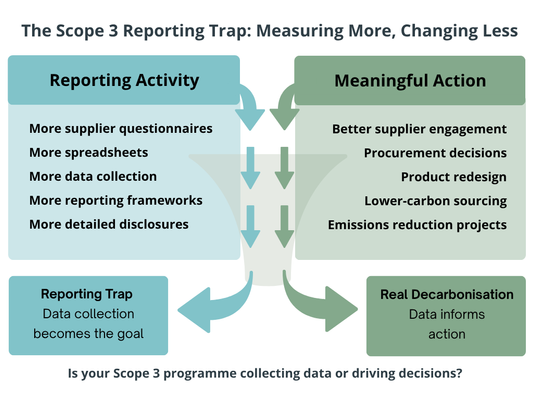
Infographic comparing Scope 3 reporting activity with meaningful decarbonisation action, showing how excessive data collection can become a reporting trap instead of driving emissions reduction decisions.
Credit: TEAM Energy
TEAM Energy
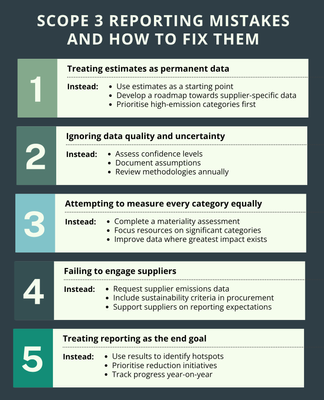
Infographic outlining five common Scope 3 reporting mistakes and practical actions to improve data quality, supplier engagement, prioritisation, and emissions reduction outcomes.
Credit: TEAM Energy
TEAM Energy
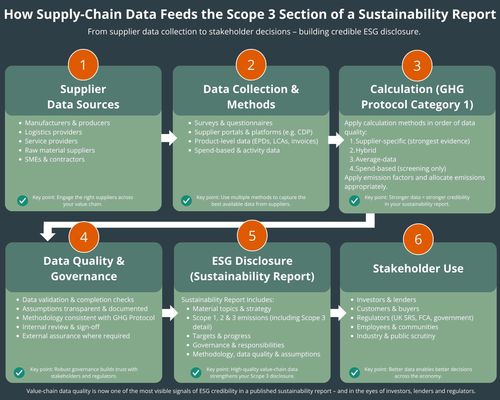
Infographic showing how supply-chain data feeds into Scope 3 sustainability reporting. The six-step process covers supplier data sources, data collection methods, emissions calculations, data quality and governance, ESG disclosure, and stakeholder use, illustrating how supplier emissions data is transformed into sustainability reporting and decision-making information.
Credit: TEAM Energy

TEAM Energy
Infographic titled ‘Benefits of a Carbon Reduction Plan’ with a central CO₂ icon surrounded by six benefit areas: reputation and brand value, economic and environmental benefits, regulatory compliance, employee engagement, innovation and efficiency, and risk management. Each section highlights outcomes such as reduced emissions and costs, legal compliance, improved resilience, operational efficiency, enhanced public trust, and increased employee motivation.
Credit: TEAM Energy
TEAM Energy
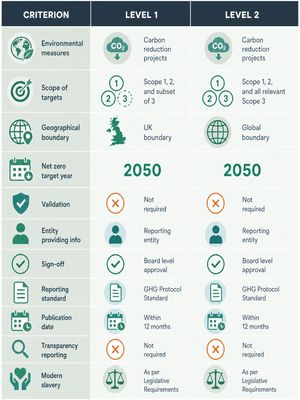
NHS Evergreen Sustainable Supplier Assessment infographic comparing Level 1 and Level 2 requirements, including Scope 1, 2 and 3 emissions reporting, net zero targets, GHG Protocol standards, carbon reduction projects, sustainability reporting, board-level approval and supply chain compliance.
Credit: TEAM Energy

TEAM Energy
Graphic titled ‘What are Scope 3 emissions?’ explaining that Scope 3 emissions come from an organisation’s supply chain and represent the largest and hardest‑to‑control share of emissions. The image lists examples including purchased goods and services, business travel, employee commuting, waste disposal, transportation and distribution, investments, leased assets and franchises, and the use of sold products.
Credit: TEAM Energy
TEAM Energy
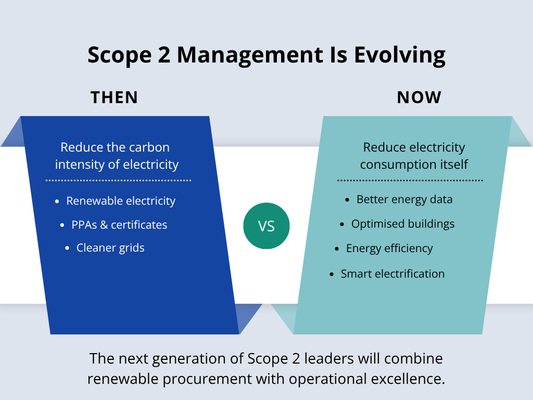
Graphic showing how Scope 2 management has evolved from renewable electricity purchasing alone to a more comprehensive approach that includes energy data, building optimisation, energy efficiency, and smart electrification to reduce electricity consumption.
Credit: TEAM Energy
TEAM Energy
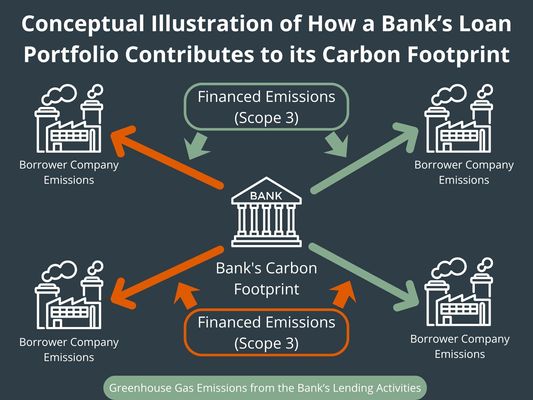
Infographic illustrating how a bank’s loan portfolio contributes to its carbon footprint through financed emissions (Scope 3). A central bank icon is connected by arrows to multiple borrower companies, showing that borrower emissions contribute indirectly to the bank’s overall carbon footprint. The diagram highlights greenhouse gas emissions generated through lending activities.
Credit: TEAM Energy

TEAM Energy
Infographic showing seven common pitfalls to avoid when creating a carbon reduction strategy: setting targets without a clear baseline, underestimating Scope 3 emissions, focusing on short‑term wins over long‑term change, over‑reliance on carbon offsets, lack of accountability, insufficient stakeholder engagement, and no clear measurement or reporting framework.
Credit: TEAM Energy
TEAM Energy
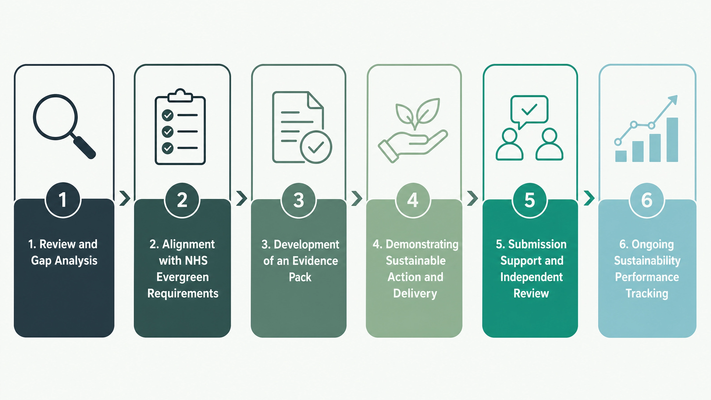
Infographic outlining the NHS Evergreen Sustainable Supplier Assessment Service process, from gap analysis and NHS Evergreen compliance alignment to evidence pack development, sustainability action delivery, submission support, independent review and ongoing sustainability performance tracking.
Credit: TEAM Energy

TEAM Energy
Infographic illustrating Scope 1, Scope 2 and Scope 3 greenhouse gas emissions across upstream, reporting company and downstream activities. Scope 1 shows direct emissions from company facilities and company vehicles. Scope 2 shows indirect emissions from purchased electricity, steam, heating and cooling. Scope 3 shows indirect emissions across the value chain, including purchased goods and services, capital goods, fuel and energy‑related activities, transportation and distribution, waste, business travel, employee commuting, processing and use of sold products, end‑of‑life treatment of sold products, leased assets, franchises and investments.
Credit: TEAM Energy
TEAM Energy
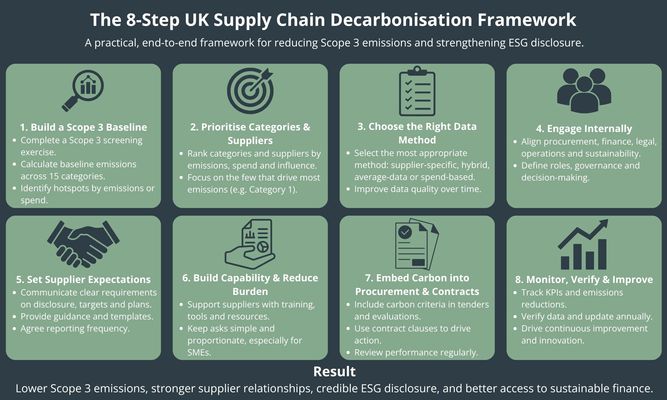
Infographic titled “The 8-Step UK Supply Chain Decarbonisation Framework” outlining a process for reducing Scope 3 emissions. The eight steps are: Build a Scope 3 Baseline, Prioritise Categories and Suppliers, Choose the Right Data Method, Engage Internally, Set Supplier Expectations, Build Capability and Reduce Burden, Embed Carbon into Procurement and Contracts, and Monitor, Verify and Improve. The framework aims to lower Scope 3 emissions, strengthen supplier relationships, improve ESG disclosure, and support sustainable finance.
Credit: TEAM Energy

TEAM Energy
Flow diagram showing how a carbon reduction plan is developed from Net Zero ambition. Inputs include energy audits and surveys such as EPCs, ESOS audits, decarbonisation audits, TM44 and capacity optimisation, combined with existing projects and energy data. These feed into a carbon reduction strategy covering scope definition, baseline emissions, target setting and progress tracking, resulting in outputs such as capacity optimisation, project management, vendor selection, behaviour change training and ongoing performance review.
Credit: TEAM Energy

TEAM Energy
Infographic titled ‘Best approach for Scope 3’ showing three connected steps: prioritising the most materially significant Scope 3 categories, engaging suppliers early and collaboratively, and using industry benchmarks and spend‑based calculations where primary data is unavailable.
Credit: TEAM Energy

TEAM Energy
Comparison graphic titled ‘What is the difference?’ showing a carbon reduction strategy versus a carbon reduction plan. The strategy focuses on defining scope, establishing greenhouse gas baselines, setting carbon reduction targets and tracking progress, while the plan outlines specific initiatives and actions to achieve carbon neutral or Net Zero targets and notes that a carbon reduction plan is required for public sector suppliers under PPN 06/21.
Credit: TEAM Energy

TEAM Energy
Infographic titled ‘Scope 1, 2 and 3 Explained’ describing the three greenhouse gas emission scopes. Scope 1 covers direct emissions from organisational operations such as on‑site fuel combustion, fleet vehicles and air conditioning. Scope 2 covers indirect emissions from purchased energy including electricity, steam, heating and cooling. Scope 3 covers wider indirect emissions including purchased goods and services, business travel, employee commuting, waste disposal, transportation and distribution, investments, leased assets and franchises, and use of sold products.
Credit: TEAM Energy

TEAM Energy
Infographic titled ‘Benefits of a Carbon Reduction Strategy’ highlighting key benefits including understanding an organisation’s carbon emissions, creating a carbon reduction plan and targets, achieving Net Zero and ESG or CSR goals, ensuring industry compliance, delivering operational cost savings and improved customer retention, differentiating from competitors, enabling ongoing monitoring and performance improvement, and building a strong sustainable reputation.
Credit: TEAM Energy