
Sustainability and Net Zero
Sustainability and Net Zero brings together a curated set of informational infographics from TEAM Energy, designed to support clear understanding of sustainability reporting, Net Zero pathways and carbon reduction. The lookbook provides journalists and stakeholders with accessible, evidence‑based visuals that explain complex concepts, regulatory contexts and best‑practice approaches.
TEAM Energy
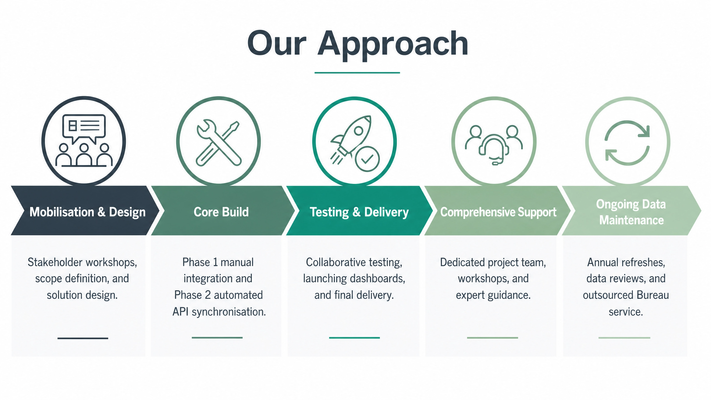
Infographic titled “Our Approach” showing a five-stage delivery process: Mobilisation & Design, Core Build, Testing & Delivery, Comprehensive Support, and Ongoing Data Maintenance. Each stage is represented by an icon and includes activities such as stakeholder workshops, system integration, dashboard testing and launch, expert support, and annual data reviews.
Credit: TEAM Energy
TEAM Energy
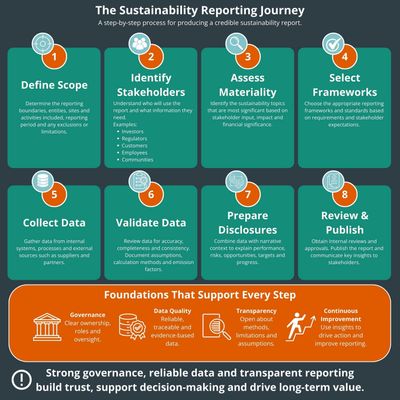
Infographic titled “The Sustainability Reporting Journey” showing an eight-step process for producing a sustainability report: Define Scope, Identify Stakeholders, Assess Materiality, Select Frameworks, Collect Data, Validate Data, Prepare Disclosures, and Review & Publish. A supporting section highlights governance, data quality, transparency, and continuous improvement as the foundations of effective sustainability reporting.
Credit: TEAM Energy
TEAM Energy
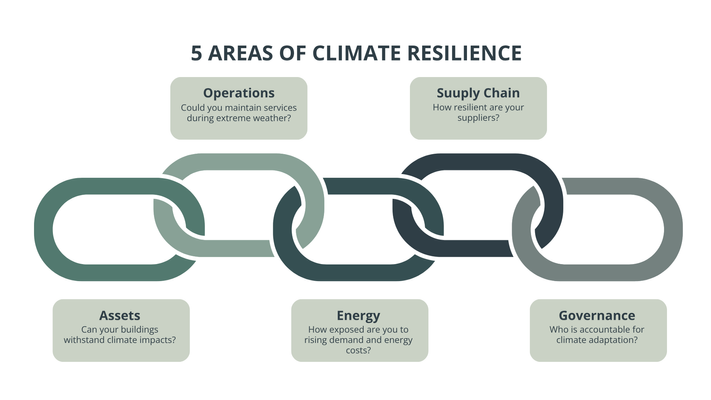
Infographic titled “5 Areas of Climate Resilience” showing five interconnected focus areas: Assets, Operations, Energy, Supply Chain, and Governance. Each area includes a question to help organisations assess their resilience to climate-related risks and impacts.
Credit: TEAM Energy
TEAM Energy
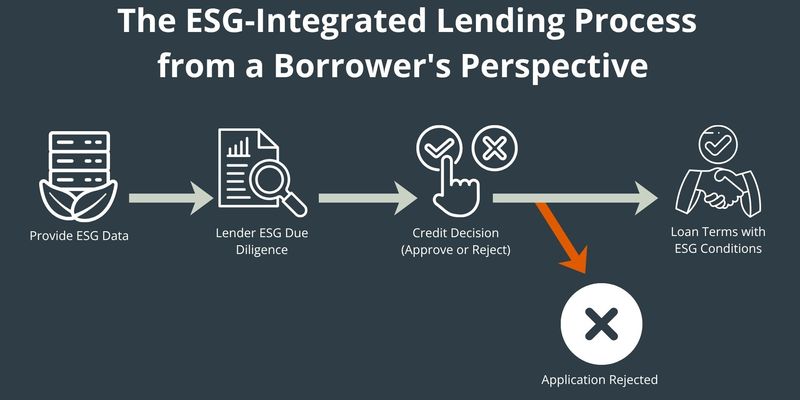
Infographic showing an ESG-integrated lending process from a borrower’s perspective. The process flows from providing ESG data, through lender ESG due diligence and a credit decision, to either loan approval with ESG-related conditions or application rejection. The diagram illustrates how ESG information can influence lending outcomes.
Credit: TEAM Energy

TEAM Energy
Bar graph displaying the answers to a question in TEAM Energy's Carbon Countdown Survey: What are the primary challenges organisations face in transitioning to net zero? The answers are: Financial Constraints as the biggest and then in order; Technology Limitations; Regulatory Compliance; Lack of expertise; Supply chain dependencies; Leadership Commitment; Data Collection and; Other
Credit: TEAM Energy
TEAM Energy
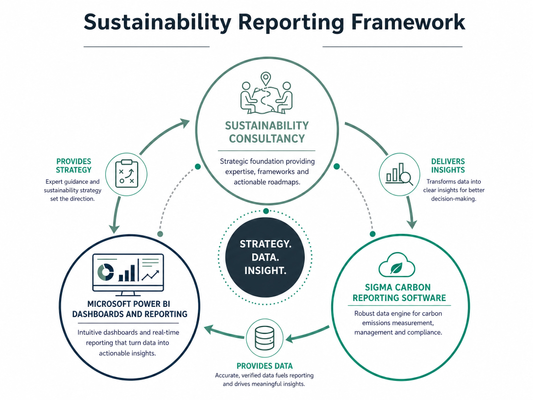
Diagram showing TEAM’s Sustainability Reporting Framework, where Sustainability Consultancy provides strategy, Sigma Carbon Reporting Software provides carbon data, and Microsoft Power BI delivers dashboards and insights. The three elements form a continuous cycle around a central hub labelled “Strategy. Data. Insight.”.
Credit: TEAM Energy

TEAM Energy
Infographic titled ‘Net Zero Roadmap for Business Leaders’ showing six steps in a progression: 1) Start with a clear vision grounded in data, 2) Build a robust, actionable business sustainability plan, 3) Integrate sustainability into core business strategy, 4) Leverage innovation and collaboration, 5) Empower people and embed cultural change, and 6) Communicate progress transparently.
Credit: TEAM Energy
TEAM Energy
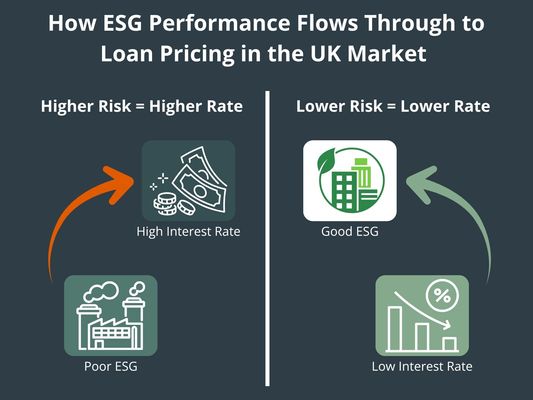
Infographic showing the relationship between ESG performance and loan pricing in the UK market. Companies with poor ESG performance are associated with higher lending risk and higher interest rates, while companies with strong ESG performance are associated with lower risk and lower interest rates, resulting in more favourable borrowing costs.
Credit: TEAM Energy

TEAM Energy
Infographic showing four connected hexagons illustrating organisational engagement for net zero: communicating sustainability aims and business value; involving staff in efficiency ideas and behavioural change; establishing internal green teams or sustainability champions; and embedding sustainability in training and development.
Credit: TEAM Energy

TEAM Energy
Flow diagram showing how a carbon reduction plan is developed from Net Zero ambition. Inputs include energy audits and surveys such as EPCs, ESOS audits, decarbonisation audits, TM44 and capacity optimisation, combined with existing projects and energy data. These feed into a carbon reduction strategy covering scope definition, baseline emissions, target setting and progress tracking, resulting in outputs such as capacity optimisation, project management, vendor selection, behaviour change training and ongoing performance review.
Credit: TEAM Energy

TEAM Energy
Process diagram showing eight steps in a sustainability data collection framework: Step 1 define sustainability metrics; Step 2 choose the right tools and partner; Step 3 data collection; Step 4 data integration; Step 5 data analysis; Step 6 report on sustainability; Step 7 continuous improvement; and Step 8 audit and scrutiny, shown as connected icons in a left‑to‑right flow.
Credit: TEAM
TEAM Energy
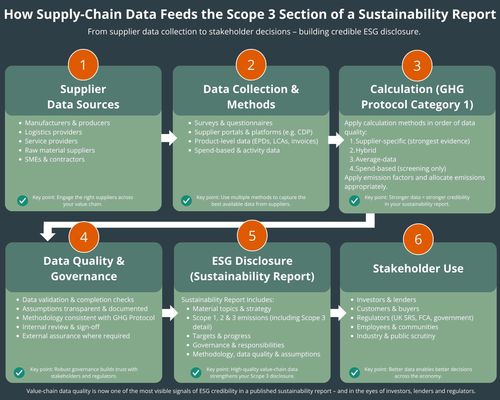
Infographic showing how supply-chain data feeds into Scope 3 sustainability reporting. The six-step process covers supplier data sources, data collection methods, emissions calculations, data quality and governance, ESG disclosure, and stakeholder use, illustrating how supplier emissions data is transformed into sustainability reporting and decision-making information.
Credit: TEAM Energy

TEAM Energy
Circular infographic illustrating the steps to achieve net zero. The cycle shows four connected stages: establish your scope; set a baseline for your operations; determine your greenhouse gas emissions targets; and track and celebrate carbon reduction success, represented by arrows forming a continuous loop with icons for data, targets, and CO₂ reduction.
Credit: TEAM Energy

TEAM Energy
Infographic titled ‘The benefits of digitalisation and automation of sustainability reporting’, listing seven benefits: improved oversight and decision‑making, operational efficiency, delivering the four key pillars of data quality, becoming a leader, managing risk, using data where and when needed, and informing carbon reduction strategy with complete reporting assurance.
Credit: TEAM Energy

TEAM Energy
Circular infographic illustrating the role of leadership and education in achieving net zero. At the centre is the message “The power of leadership and education in net zero transformations,” surrounded by nine connected themes: setting the vision; establishing goals and climate science targets; building a culture of sustainability; promoting cross‑functional collaboration; leading by example; building a diverse and inclusive team; adopting transparency and accountability; investing in sustainability education and training; and fostering collaboration and knowledge sharing.
Credit: TEAM Energy

TEAM Energy
Diagram showing an automated sustainability reporting data pipeline with five stages: Identify sustainability data sources; Extract data using APIs, EIDs, IoT and Excel; Transform data through validation and formatting; Load data into a target database; and Report using business intelligence tools and carbon accounting software, enabling near real‑time sustainability reporting.
Credit: TEAM Energy

TEAM Energy
Infographic showing the proportion of organisations that have made a formal commitment to achieve net zero emissions, the answer to a TEAM Energy Carbon Countdown Survey Question. A pie chart indicates that 48.6% have committed to net zero, 29.4% are in progress, and 22% have not made a commitment.
Credit: TEAM Energy

TEAM Energy
Infographic titled ‘5 Common Net Zero Myths Explained’ showing five overlapping coloured circles. Each circle contains a myth and explanation: Myth 1 states net zero does not mean zero emissions but reducing emissions as far as possible and offsetting residuals. Myth 2 explains net zero is not only about carbon, covering multiple greenhouse gases. Myth 3 counters that net zero is not too expensive, noting inaction costs more and the transition can deliver savings and resilience. Myth 4 states net zero is not only for big corporations, highlighting the role of small businesses. Myth 5 explains net zero is not a distant goal, emphasising that meaningful progress begins with early action.
Credit: TEAM

TEAM Energy
Infographic showing four connected hexagons illustrating organisational engagement for net zero: communicating sustainability aims and business value; involving staff in efficiency ideas and behavioural change; establishing internal green teams or sustainability champions; and embedding sustainability in training and development.
Credit: TEAM Energy