Flowchart infographic showing how an organisation can use an energy efficiency survey to support net zero plans. The process moves from baseline assessment to identifying inefficiency, prioritising ac...
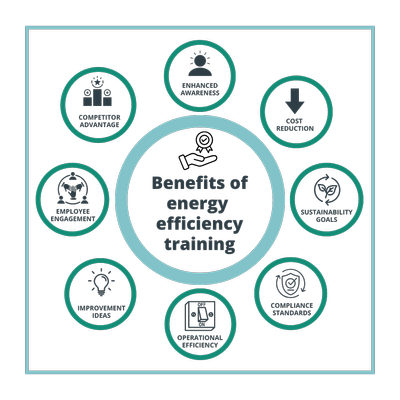
Infographic illustrating the benefits of energy efficiency training. At the centre is the title “Benefits of energy efficiency training,” surrounded by eight icons representing enhanced awareness, cos...
Infographic illustrating the energy efficiency hierarchy in four connected stages. Stage one focuses on data analysis and benchmarking; stage two on minimising building energy needs; stage three on ma...
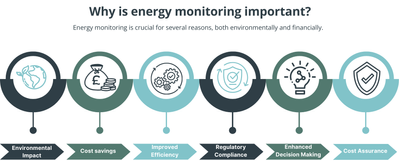
Infographic explaining why energy monitoring is important, highlighting both environmental and financial benefits. A horizontal sequence of icons illustrates six key reasons: reduced environmental imp...
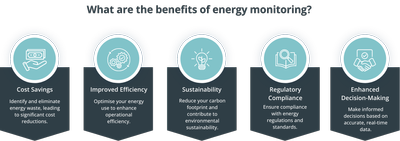
Infographic outlining the benefits of energy monitoring. Five key benefits are shown using icons and captions: cost savings through identifying and eliminating energy waste; improved efficiency by opt...
Circular infographic showing the energy management cycle. The cycle is divided into five connected stages: understanding energy use; planning and organisation; implementation; verification, monitoring...
Process diagram showing the energy management process from inputs to outputs through an energy review. Inputs include data capture and management, estate segmentation and profiling, historical and c...
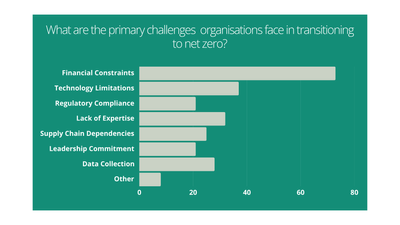
Bar graph displaying the answers to a question in TEAM Energy's Carbon Countdown Survey: What are the primary challenges organisations face in transitioning to net zero? The answers are: Financial Con...
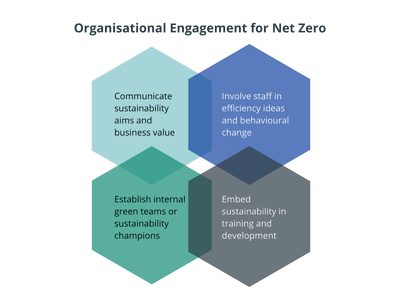
Infographic showing four connected hexagons illustrating organisational engagement for net zero: communicating sustainability aims and business value; involving staff in efficiency ideas and behaviour...
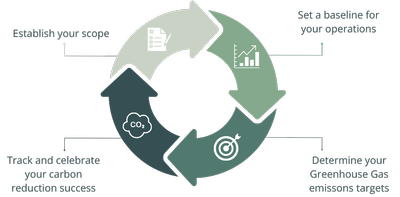
Circular infographic illustrating the steps to achieve net zero. The cycle shows four connected stages: establish your scope; set a baseline for your operations; determine your greenhouse gas emission...
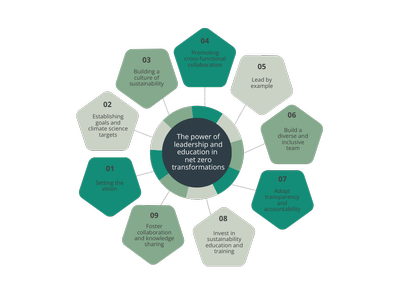
Circular infographic illustrating the role of leadership and education in achieving net zero. At the centre is the message “The power of leadership and education in net zero transformations,” surround...
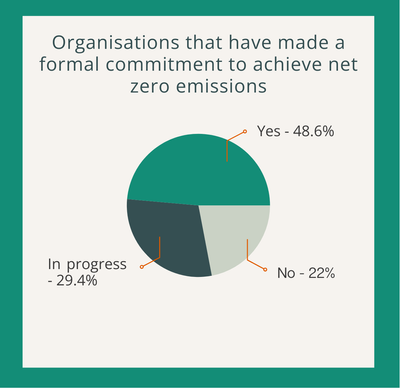
Infographic showing the proportion of organisations that have made a formal commitment to achieve net zero emissions, the answer to a TEAM Energy Carbon Countdown Survey Question. A pie chart indicate...
Infographic showing four connected hexagons illustrating organisational engagement for net zero: communicating sustainability aims and business value; involving staff in efficiency ideas and behaviour...
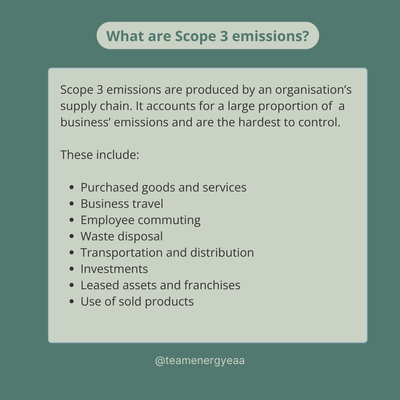
Graphic titled ‘What are Scope 3 emissions?’ explaining that Scope 3 emissions come from an organisation’s supply chain and represent the largest and hardest‑to‑control share of emissions. The image l...
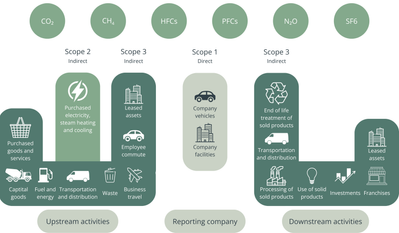
Infographic illustrating Scope 1, Scope 2 and Scope 3 greenhouse gas emissions across upstream, reporting company and downstream activities. Scope 1 shows direct emissions from company facilities and...
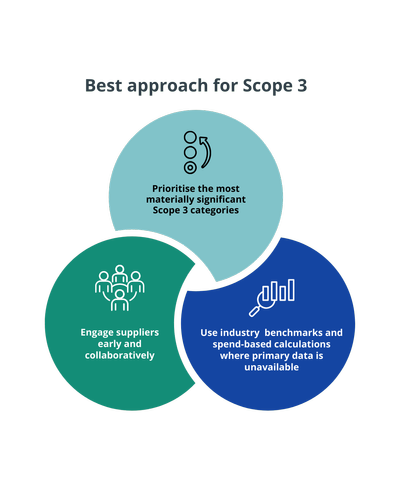
Infographic titled ‘Best approach for Scope 3’ showing three connected steps: prioritising the most materially significant Scope 3 categories, engaging suppliers early and collaboratively, and using i...
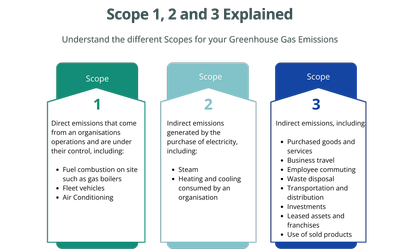
Infographic titled ‘Scope 1, 2 and 3 Explained’ describing the three greenhouse gas emission scopes. Scope 1 covers direct emissions from organisational operations such as on‑site fuel combustion, fle...
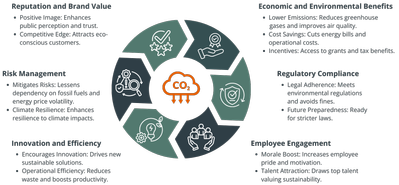
Infographic titled ‘Benefits of a Carbon Reduction Plan’ with a central CO₂ icon surrounded by six benefit areas: reputation and brand value, economic and environmental benefits, regulatory compliance...
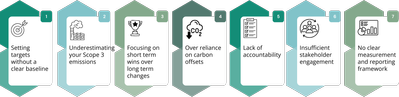
Infographic showing seven common pitfalls to avoid when creating a carbon reduction strategy: setting targets without a clear baseline, underestimating Scope 3 emissions, focusing on short‑term wins o...
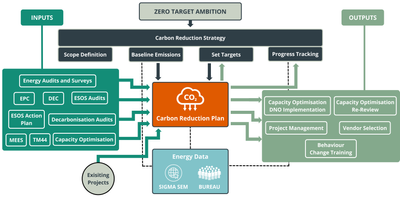
Flow diagram showing how a carbon reduction plan is developed from Net Zero ambition. Inputs include energy audits and surveys such as EPCs, ESOS audits, decarbonisation audits, TM44 and capacity opti...
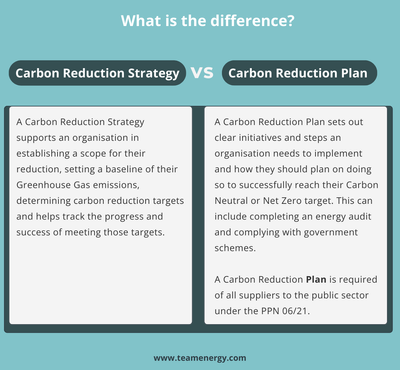
Comparison graphic titled ‘What is the difference?’ showing a carbon reduction strategy versus a carbon reduction plan. The strategy focuses on defining scope, establishing greenhouse gas baselines, s...
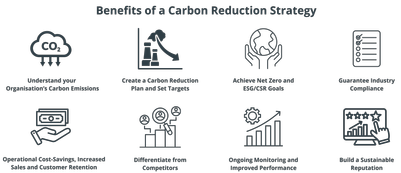
Infographic titled ‘Benefits of a Carbon Reduction Strategy’ highlighting key benefits including understanding an organisation’s carbon emissions, creating a carbon reduction plan and targets, achievi...
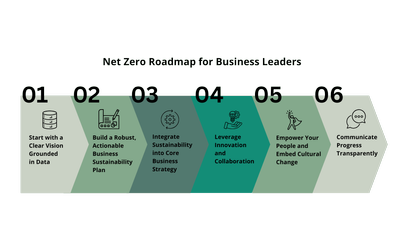
Infographic titled ‘Net Zero Roadmap for Business Leaders’ showing six steps in a progression: 1) Start with a clear vision grounded in data, 2) Build a robust, actionable business sustainability plan...
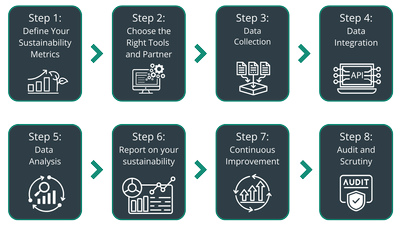
Process diagram showing eight steps in a sustainability data collection framework: Step 1 define sustainability metrics; Step 2 choose the right tools and partner; Step 3 data collection; Step 4 data...